Showing posts with label stats and graphs. Show all posts

Thursday, June 11, 2015

Yet another survey released

Must be survey season. PRRI (the Public Religion Research Institute) has come out with their survey.
Fifty-five percent of the public favors allowing gay and lesbian couples to marry legally, while 37% are opposed. Strong generational, religious, and partisan divisions persist on the issue.
and
Nearly seven in ten (69%) Americans favor laws that would protect LGBT individuals against discrimination in jobs, public accommodations, and housing, compared to 25% who oppose such policies.
 Meanwhile, the mini-RFRAs aren't too popular,
Six in ten (60%) Americans oppose allowing a small business owner to refuse products or services to gay and lesbian people, even if doing so violates their religious beliefs, while 34% support such a policy.

While majorities of most religious groups oppose these so-called “religious freedom” laws, white evangelical Protestants (51%) are the only religious group with majority support. Forty-two percent of white evangelical Protestants oppose allowing small businesses to refuse products or services to gay and lesbian people on religious grounds. By contrast, 59% of white mainline Protestants, 63% of non-white Protestants, and 64% of Catholics oppose allowing small business owners to refuse service to gay and lesbian people on religious grounds, as do nearly three-quarters (73%) of religiously unaffiliated Americans.
 The director states the obvious,

“As national opinion has shifted toward support for LGBT rights, including among religious Americans, white evangelical Protestants are increasingly becoming an island of opposition amidst a sea of acceptance,” said Dr. Robert P. Jones, CEO of Public Religion Research Institute. “Today, white evangelical support remains below the level of support from a decade ago in the general public, and they are also less likely than other religious groups to acknowledge that LGBT Americans face discrimination.”

Tuesday, June 9, 2015

New Pew Poll; Marriage equality "inevitable"

There's a new poll from Pew on marriage equality and it finds over 70% believe legal same sex marriage is "inevitable". The numbers are the same for Republicans who generally oppose, as for Democrats who generally favor.  Overall, 57% favor equality.  This is similar to other polls.
As support for same-sex marriage has increased, other attitudes about homosexuality have changed as well. Majorities now say homosexuality should be accepted by society (63%) and that the sexual orientation of a gay or lesbian person cannot be changed (60%). Nearly half (47%) say that people are born gay or lesbian. These opinions represent a shift over the past decade, even if in some cases the short-term changes have been modest.

In addition, a 54% majority says there is no conflict between their own religious beliefs and homosexuality, up from 48% in 2013. However, the view that homosexuality and one’s personal religious beliefs are in conflict remains a powerful factor in opposition to same-sex marriage.

An overwhelming majority of the public (88%) reports personally knowing someone who is gay or lesbian. That is little changed since 2013, but much higher than in the early 1990s.
Not surprisingly, the more likely you are to have gay friends, the higher your level of support.

And can we just stop with the falsehood that religion is opposed to equality?  It's a SUBSET of religion that is opposed.

Wednesday, October 8, 2014

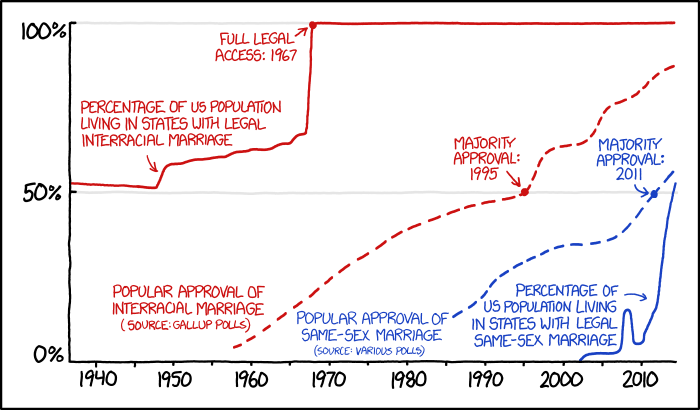
Inter-racial marriage vs same-sex marriage

I've made this comparison before (e.g., here) but now someone else has managed to get it noticed more broadly.  You'll note that the slope of the two "approval" curves is very similar.  What's not similar is that if this were truly parallel, marriages between same sex partners would have been legal in ca. 1990.


Just for grins, here's my version from 2012:


Tuesday, March 18, 2014

Increasing support for marriage equality from many mainstream Christians

From Pew Research:
The long-standing tension between religious beliefs and the idea of same-sex marriage has been a key factor at play behind recently proposed bills in several states, most visibly in Arizona, aimed at protecting business owners who have religious objections to same-sex marriage. At the same time, however, new Pew Research Center data from 2014 show that just within the past year, growing shares of some Christian groups favor allowing gay and lesbian couples to marry.

Notable is increasing support from White Mainline Protestants and Catholics, who are both around 60% supportive.  Black Protestants are also increasing.  White evangelicals?  Not so much.  But why is our freedom to marry dictated by a minority religious group that accounts for maybe 20% of the US?  "Unaffiliated" is also around 20% of the US population.


Wednesday, February 26, 2014

New survey: support for marriage equality >50%

From PRRI:
Currently, a majority (53%) of Americans favor allowing gay and lesbian couples to legally marry, compared to 41% who oppose.... 
.... Today, there are major religious groups on both sides of the issue. Religiously unaffiliated Americans (73%), white mainline Protestants (62%), white Catholics (58%), and Hispanic Catholics (56%) all favor allowing gay and lesbian couples to marry. A majority (83%) of Jewish Americans also favor legalizing same-sex marriage. Hispanic Protestants are divided; 46% favor allowing gay and lesbian couples to legally marry and 49% oppose. By contrast, nearly 7-in-10 (69%) white evangelical Protestants and nearly 6-in-10 (59%) black Protestants oppose same-sex marriage. Only 27% of white evangelical Protestants and 35% of black Protestants support same-sex marriage. 
....Majorities of Americans perceive three religious groups to be unfriendly to LGBT people: the Catholic Church (58%), the Mormon church (53%), and evangelical Christian churches (51%). Perceptions of non-evangelical Protestant churches, African-American churches and the Jewish religion are notably less negative. 
„„At least two-thirds of LGBT Americans perceive both the Catholic Church (73%) and evangelical Christian churches (67%) as being unfriendly toward LGBT people.
Nearly 6-in-10 (58%) Americans agree that religious groups are alienating young people by being too judgmental on gay and lesbian issues. ... 
Among Americans who left their childhood religion and are now religiously unaffiliated, about one-quarter say negative teachings about or treatment of gay and lesbian people was a somewhat important (14%) or very important (10%) factor in their decision to disaffiliate.
 

Friday, June 14, 2013

Survey of LGBT Americans

There's a new poll out from Pew, surveying LGBT Americans.  One caveat, they have about 40% self-identified bisexuals, which seems a bit high.  And as Andrew Sullivan says, aggregating LGBT all together is a bit problematic, since the experience of bi or trans people is obviously quite different from that of lesbians and gays.  Still, it's interesting.  Some of the findings:

Bisexuals are closeted.


And,
As for gender patterns, the survey finds that lesbians are more likely than gay men to be in a committed relationship (66% versus 40%); likewise, bisexual women are much more likely than bisexual men to be in one of these relationships (68% versus 40%). In addition women, whether lesbian or bisexual, are significantly more likely than men to either already have children or to say they want to have children one day.


Thursday, March 28, 2013

The future

The estimable Nate Silver of the statistics blog FiveThirtyEight has been looking at polling for marriage equality, and makes some predictions.  Folks, we're going to have to win a few more states at the ballot box before the Supremes get it.


Thursday, February 28, 2013

Who's next?

From the New Civil Rights Movement:  what states are next?
Advocates now believe marriage could be extended to same-sex couples in Oregon, Rhode Island, Delaware, Minnesota, Colorado, Hawaii and New Jersey, after this month’s wins in Washington, Maine,Maryland, and Minnesota, (where voters refused to ban same-sex marriage in their constitution) according to a report in Politico, which notes that “activists are aiming to quickly use the momentum from this year’s election to boost marriage legalization efforts in at least seven new states and force Congress and the president to make major changes in discrimination laws.”


New Poll in CA: marriage support 61%

ThinkProgress points us to a new Field poll :


Thursday, December 20, 2012

Why straight people support marriage equality

But what I found most revealing and instructive was this: among voters who saw the desire by gays and lesbians to be legally wedded as a bid primarily for the rights and protections that heterosexual couples have, same-sex marriage was a loser. Only 26 percent of them voted for its legalization, while 74 percent voted against. 
But among voters who believed that gays and lesbians were chiefly interested in being able to pledge the fullest and most public commitment possible to their partners, same-sex marriage was a huge, huge winner. Eighty-five percent of those voters supported it, while only 15 percent opposed it. 
That’s a fascinating microcosm of, and window into, broader political dynamics. When an initiative in this country is framed or understood largely as an attempt by a given constituency to get more, the opposition to it is frequently bolstered, the resistance strengthened. Even if the constituency is trying to right a wrong or rectify a disadvantage. 
“Give me” can be a risky approach. “Let me” is often a better one, and when voters hear gays and lesbians asking to participate in a hallowed institution for the most personal and heartfelt of reasons, voters may have a more positive reaction. At least that’s the suggestion of the research and the interviews that Third Way has done.
 ....
[Opposition is also from] the most frequent churchgoers. The Third Way report notes that “religiosity correlated to marriage opposition in Washington. While marriage lost among regular churchgoers (those who attend once a week or more), the referendum garnered 53 percent support among those who attend church once or twice a month.”
And that is one of the reasons the biggest growing religious identification in the US is "none".

Thursday, December 13, 2012

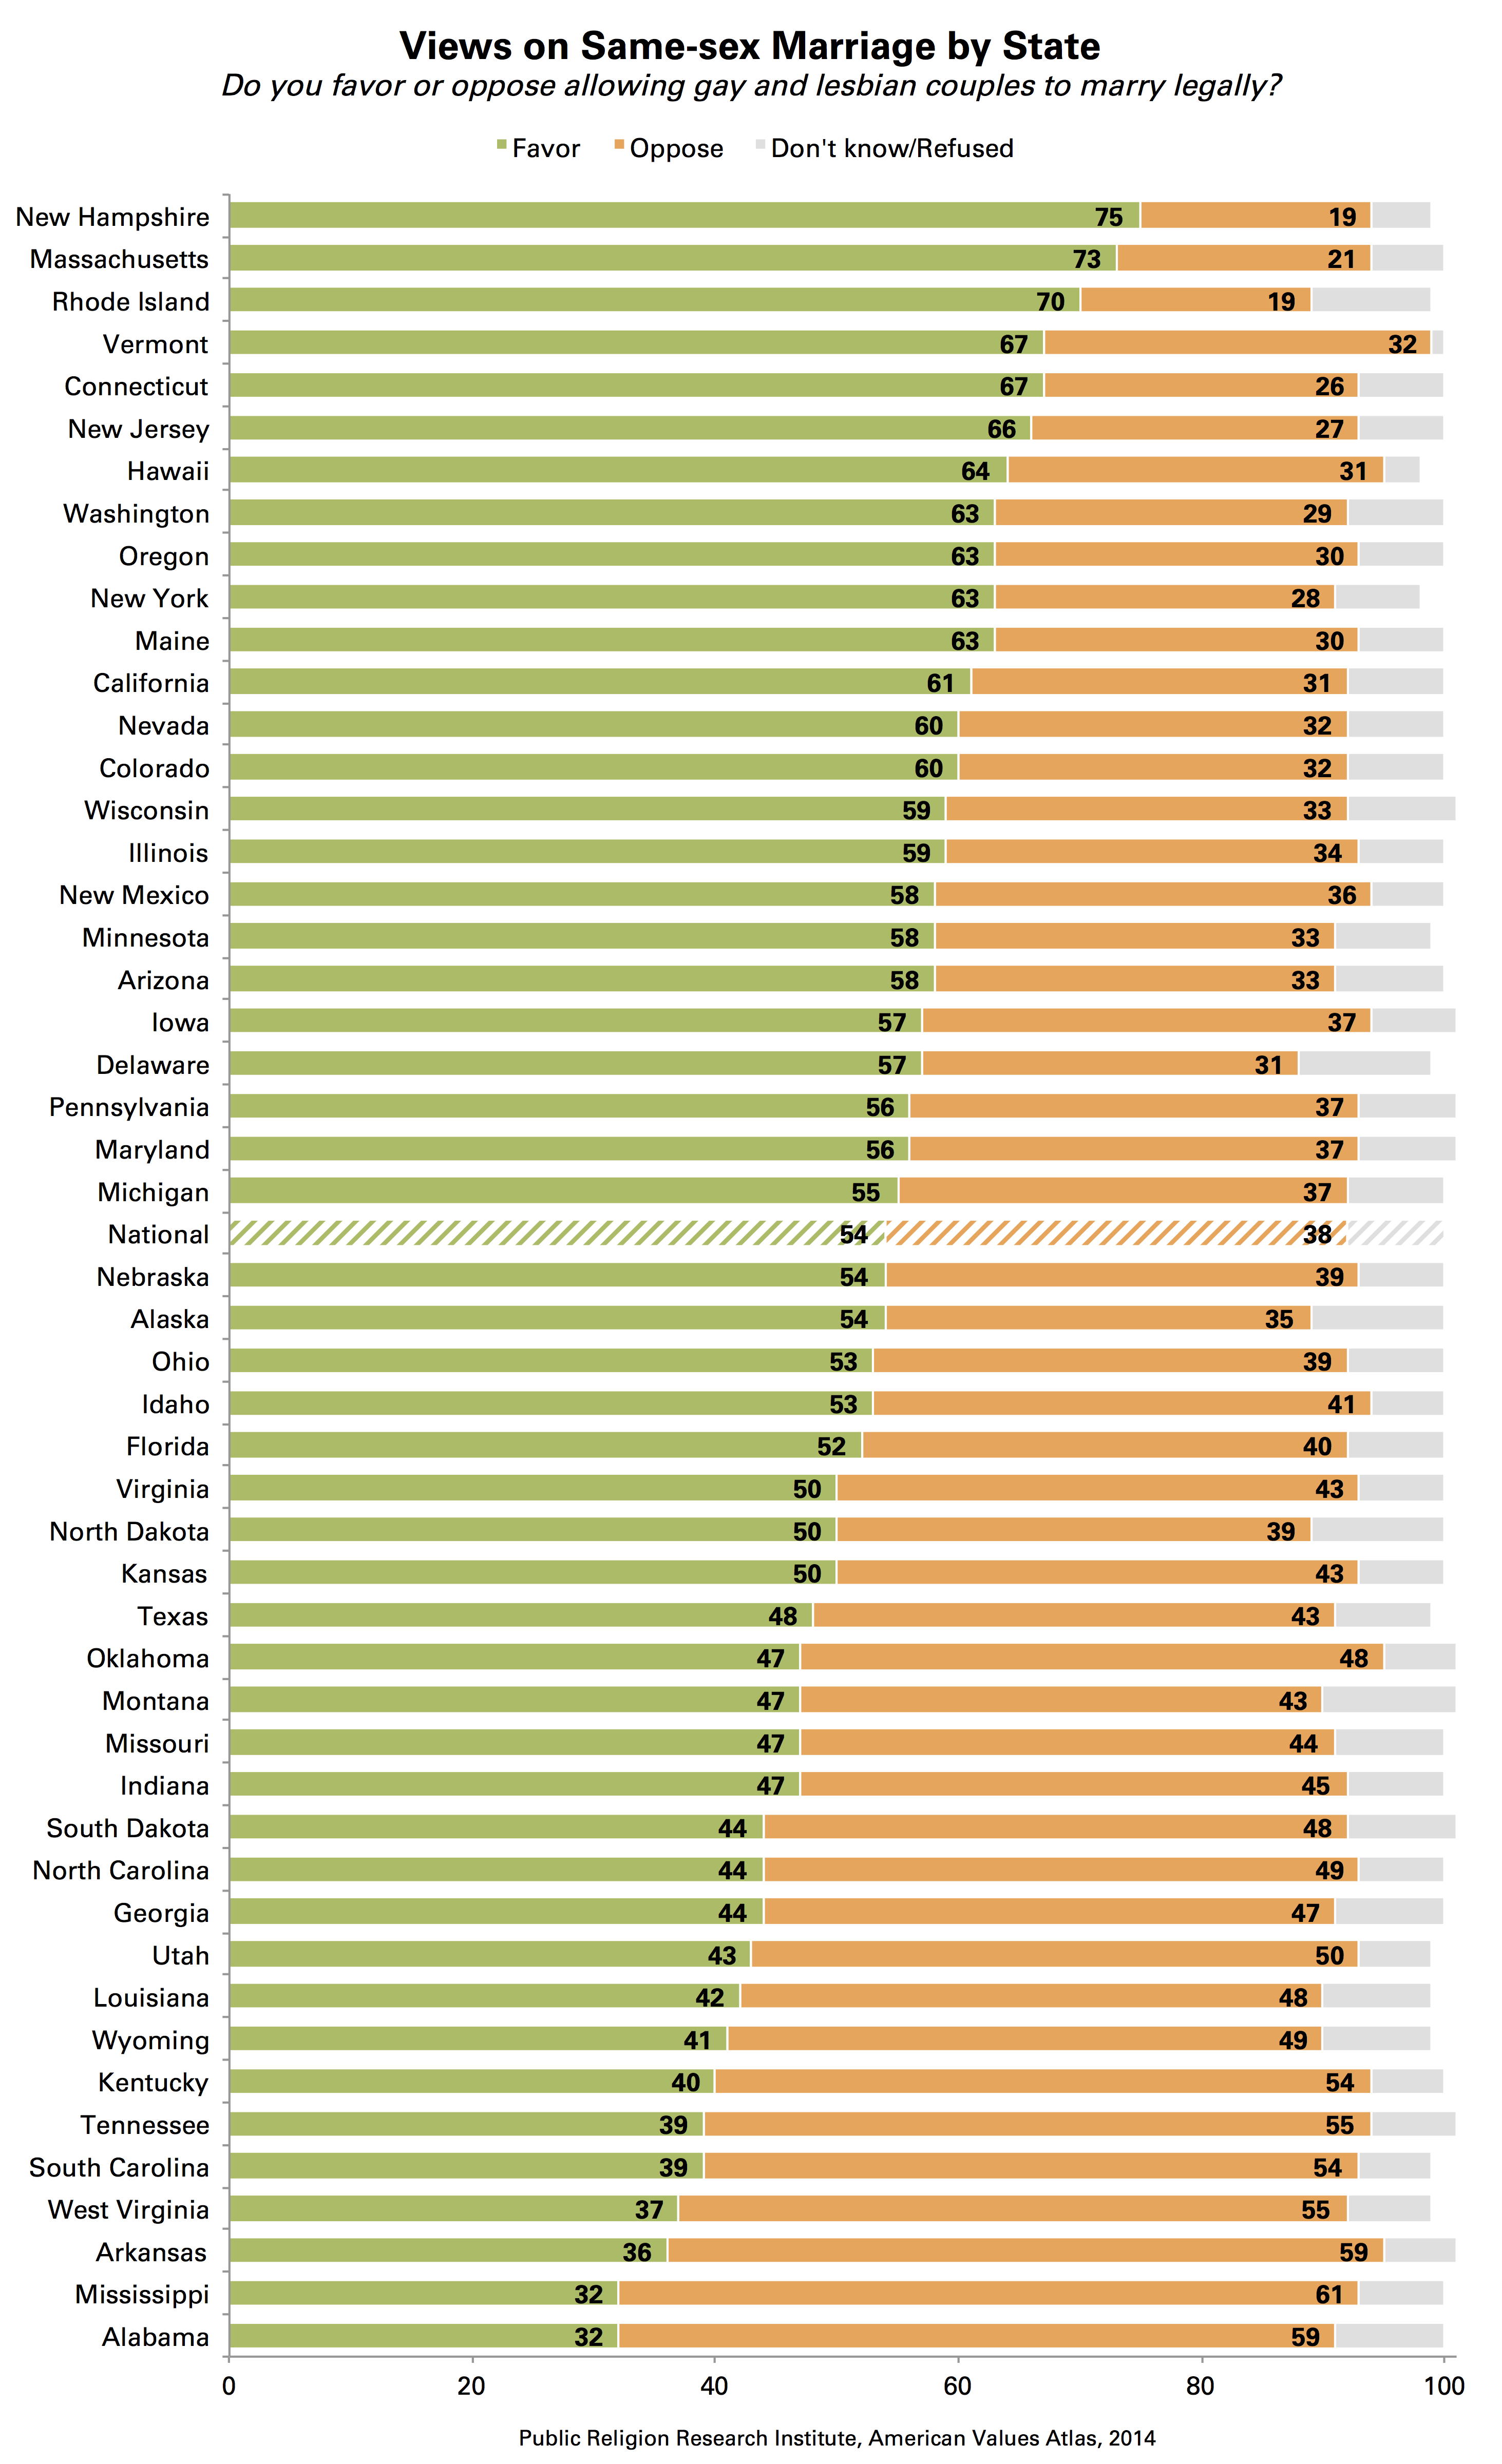
Regional variation in marriage support

From The Pew Forum: 

The South is where the country as a whole was 10 years ago.  And way behind New England.


Monday, December 10, 2012

Why we'll win eventually


They have a great selection of interactive slides.  Also, here's the problem--and the promise:


Thursday, November 29, 2012

Public Values: being gay vs having an affair

Should someone be disqualified from holding a job because they are gay? What if they had an extra-marital affair? YouGov asked the question and broke down the results for us based on political identity, and I graphed the data.

Each of the jobs is indicated below.  The numbers were calculated by taking the percent of respondents who think the person should keep their job, and subtracting the percentage who thinks they should quit.  If the number is positive, it means more people think the person should stay then go.  If the number is negative, more people think the person should quit.  The height of the bar indicates the magnitude of the difference;  thus if the number who say "stay" equals the number who say "quit", there will be no bar at all (because the difference = 0).

So, for example, a majority of respondents of all political beliefs thinks that a minister who has an affair should quit.  By contrast, a majority of conservatives think minister should quit if he's gay, while a majority of liberals and moderates think he should not.

Blue means liberal, Green means moderate, and Red means conservative.

Tuesday, September 4, 2012

New resource for equality

An anonymous commenter left us a link to a site with a comprehensive summary of where we are in the different states.  Click on the image to go to the Marriage Equality Current Status page from Marriage Equality USA.